Introduction
In the previous post, I showed you how to configure alerting in NetBeez. It’s time to set up some reports to see how well your network is performing. Today, we will review the four types of reports, how to configure them and what type of data each report can give you.
Types of Reports
There are four major types of reports, some overlap but show a different point of view such as the performance to all targets from a single agent, or the performance from all agents to a single target. Currently, NetBeez supports the following four types of reports:
- Network Status
- Agent
- Target
- Scheduled Tests

Network Status
This will give you a brief overview of how your network is performing. You can select agents individually or by groups and select any number of targets. This is a great starting point to review how many critical alerts happened for each agent and target for a given period of time. This can help with making configuration changes within NetBeez or your network.
The top half of the report will show each agent, its uptime (availability), speedtest (aggregated for the time period selected) and how many critical alerts (consecutive failures) and performance alerts that were seen, in this case the past seven days.

The bottom half will be the targets and how well they performed across all agents. You can also switch between failure and success rate. Ping has a requirement of 99% or under 100 ms. to be considered ideal for reporting and ping is usually where you see the most alerts due to its frequency.

Agent
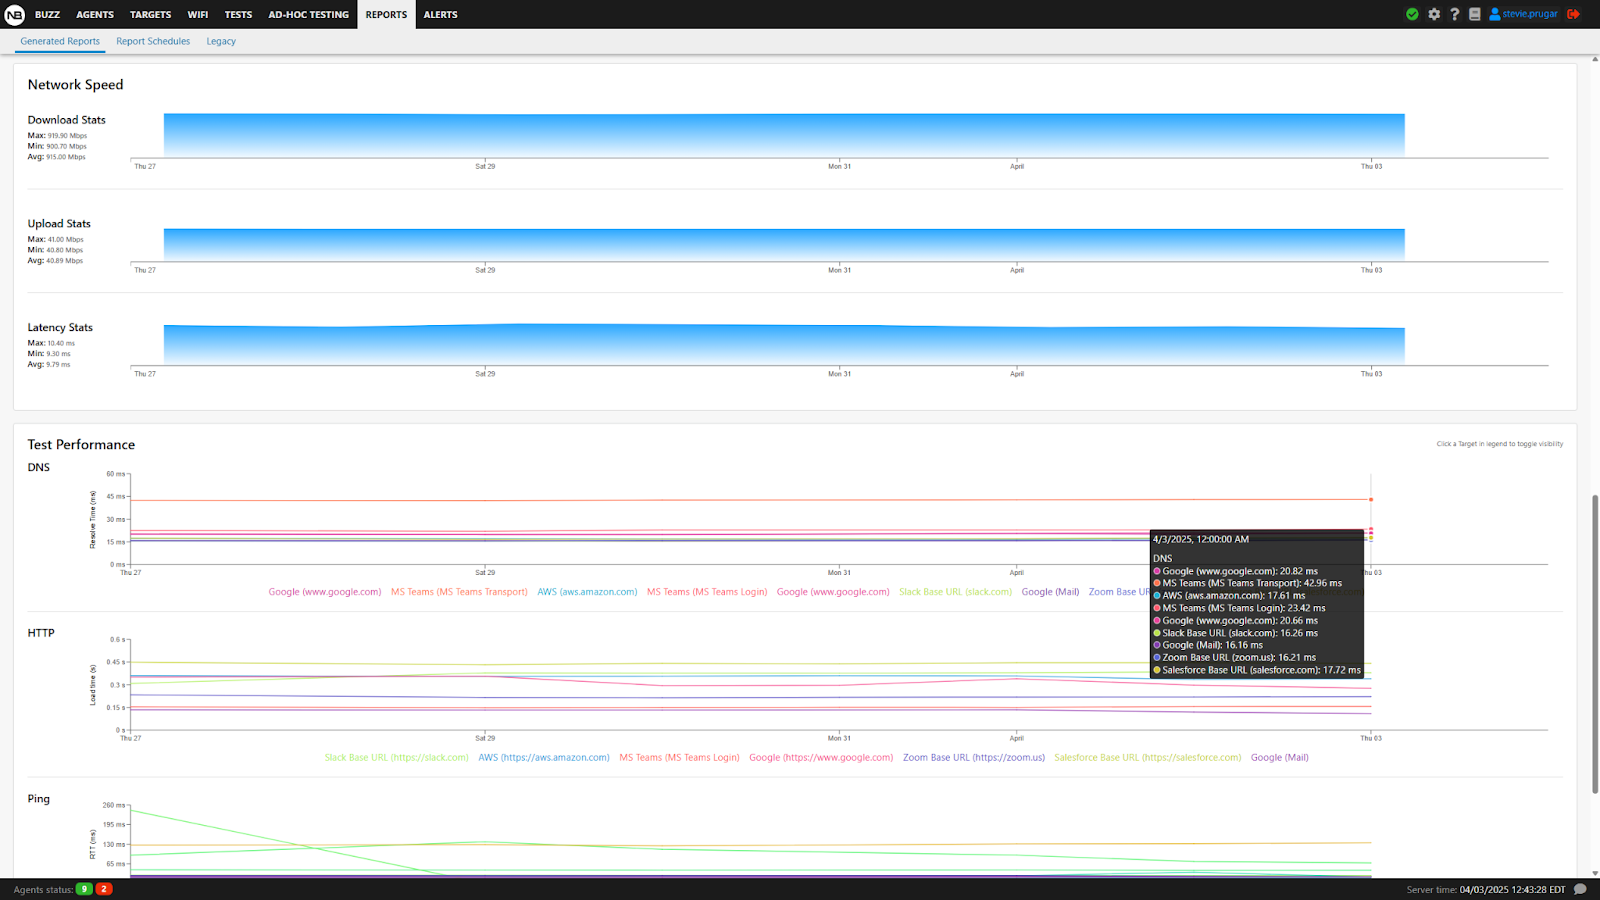
These reports will allow you to view a single agent against all of its active targets. It also provides speed test data with a timeline, min, max and averages as well as real time graphs over the time period.
For the top half, very similar to the target section of the network status report, except these aggregates are solely based on the single agent that we are looking at. It has the same option for success/fail rates as well as the same metric thresholds for green/red ratings.

The bottom half is where the speedtest and real time metric data is. The real time graphing will change depending on what you select for the time period.
- 1 day (24hr): Minute Averages
- 1 day - 7 Days (168hr): Hourly Averages
- 7 days+: Daily Averages
And at the bottom where the legend is, if you click on any of the agent tests, it will remove it from the chart for easier comparison. And you can click it again to be re-added. It will simply fade when deactivated.
Target
The target report is essentially the inverse of the agent report. You select a target and it breaks down aggregated performance from each agent.

The main difference comes at the bottom where there can be up to four bar graphs (if you also use traceroute). You will get a graph breakdown based on how many agents are performing at each threshold. So you can see if different agents are performing better or worse and how many. And like the agent report, you can deselect agents by clicking the legend.

Scheduled Tests
The schedule test report allows you to select by either agents or the test itself. This gives you the granularity on how you want to present the data. Because scheduled tests support grouping including default groups, if you select a specific test, any new agents will be added on automatically without additional overhead.

The top half of the schedule test report will have all of the test information as well as a scatter plot. This is incredibly useful for large deployments, especially around a RWA deployment where you may have hundreds or thousands of agents deployed.

The bottom half of the report will have a chart with averages, errors (failed to start), warnings (fell below a threshold set).

Then at the very bottom you will see several bar graphs (for speed tests) to breakdown performance by ISP both aggregated averages and relative scoring. For Iperf, you’ll see a line graph here instead.

Generated vs Scheduled vs Legacy
When you go to make a report, you’ll be faced with three options: Generate Reports, Report Schedules and Legacy. Legacy is our older report design and is being subsetted in the near future but can still be used.
Generated and scheduled are the 2 primary ways when interacting with our reports. Generated makes a one time report where you specify an exact date range either: Today (up until now), yesterday, last 7, last 30, last 90 or custom.

Report Schedules looks very similar except it’s missing custom as well as has an email schedule option. The scheduling is extremely granular from multiple times per day or until once per week. You can go as granular as receiving a report at 8am, 12pm and 5pm. And you can email it to anyone you’d like.

There is one requirement for emailing reports in the new implementation, the user HAS to have access to the subnet that the server is on. This is because the email contains a link to the report, which is displayed on the dashboard. Which means, if the server is behind a firewall, users will need to be able to reach that network. If the server is hosted in the cloud or by NetBeez,this isn’t an issue as hosted servers are publicly accessible. Moreover, you will need to enable the “Publicly Viewable Reports” tab under NetBeez Settings → Users as seen below:

If the user does not have a NetBeez account, this will still work, the user will still be emailed a link to the report and even without an account it will pull up the report. The entire top/navigation portion of NetBeez is removed and is just a basic web page with all of the data.

Mistakes to Avoid
Don’t overdo it. Making a report for each agent/target is incredibly time consuming. Try to focus on key locations or targets where the data is the most useful. While the legacy reporting did support agent groups, there are so many data points that it becomes very difficult to show in a concise and readable format. As mentioned previously, each agent’s single ping test creates 17,280 data points per day. Multiplied by 20 agents, 20 tests and 7 days, we are at nearly 50 million points of data per week.
Network Status and Schedule tests are your friends, it should give a good overview of network performance all wrapped up in 2 single reports. Target reports are great for monitoring key applications and agent reporting is great for troubleshooting and monitoring key sites.
Conclusion
NetBeez is an incredibly powerful tool that can give you a LOT of data about your network. When configured properly, you will be able to use NetBeez to maintain user satisfaction. And, just a quick teaser, we are working on Daily AI Reporting Summaries. This will give you a daily digest of key/isolated issues and some suggestions of what may be causing them. Stay tuned for version 14.5 for this and let us know how you like it!